| Message/Author |
|
|
|
|
Hello,
Have recently developed output from CAESAR showing velocity magnitude and direction,
Examples are shown below, First one is a large area view of a section of the river Feshie - c.20m3s-1 flow.
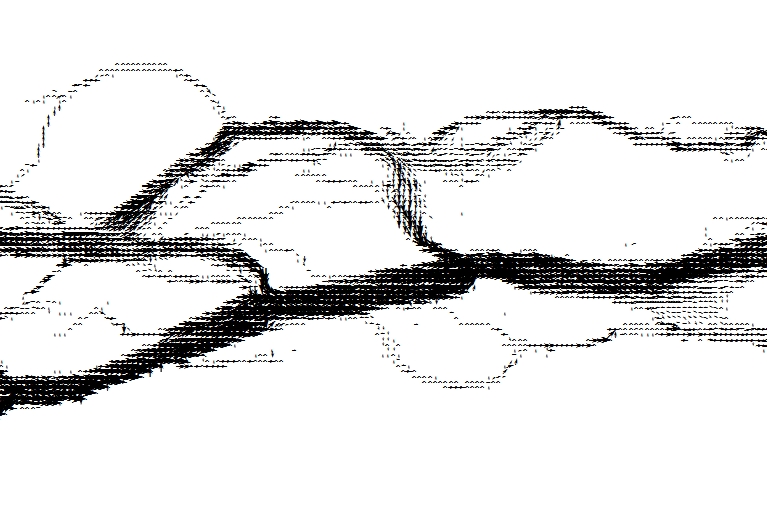
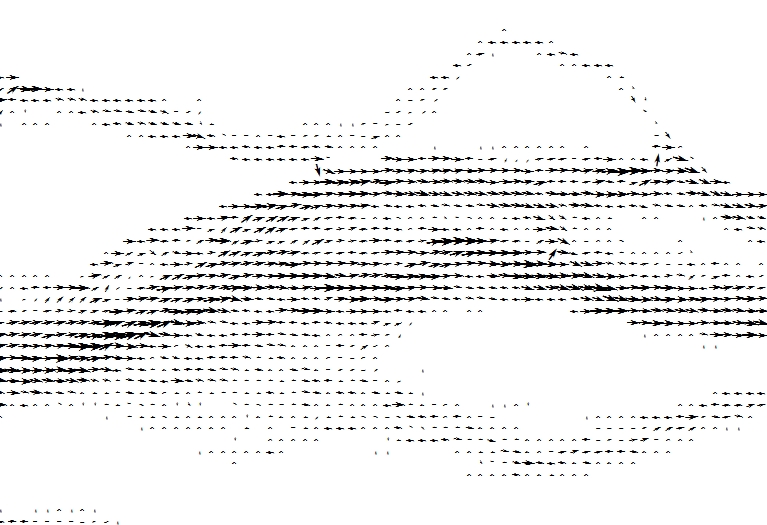
The next two shots are zoomed in sections of two parts of this image, showing more detail. There is no tendency to follow 45 degree tracks, thats the way the channels are burned into the dem on this example
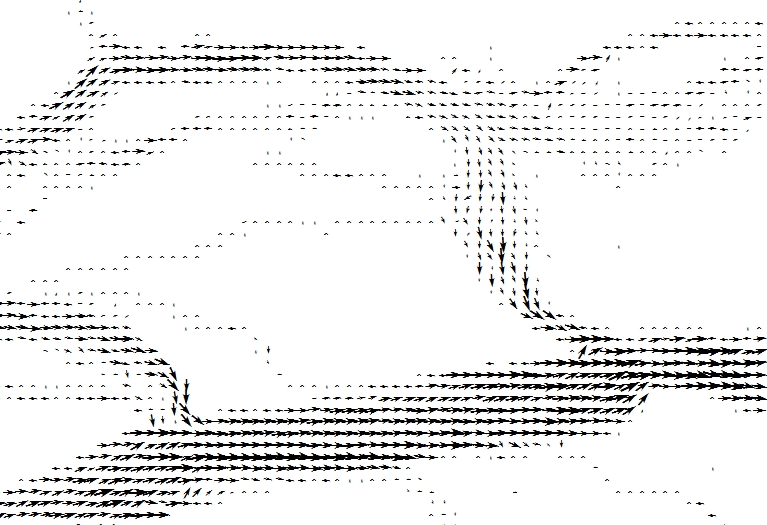
and this is from a simple sinusoidal meandering channel (the lowmeander 2 example) - I think its a little bold to suggest there are stronger velocities on the outside edge of the bends, but there might be.. of course its probably chance!

Tom |
|
|
 Tri (Tri) posted on Tuesday, July 10, 2007 - 08:11 am Tri (Tri) posted on Tuesday, July 10, 2007 - 08:11 am
|
|
|
Dear Prof.,
I have run CAESAR and I have obtained the flowvector.txt. However, I do not know how to display this file in ArcGIS. Could you please let me know?
Best regards,
Tri Van |
|
|
|
|
Hi Tri,
OK, it outputs the data in a different format - point data as opposed to raster. The file has four columns, x,y,vel and rotation. In ARC GIS click on tools, add xy data, then select the file (flowvector.txt) then select the x and y cols in the tabs below - and the data is then imported as points.
You then need to alter the symbology in the properties for the layer - find arrows - which you can size according to velocity, and also change the rotation according to the degrees column. I cannot remember how to do it precisely, but if you fiddle around in ARC GIS you should get it to work.
Tom |
|
|
| Tri (Tri) posted on Thursday, July 12, 2007 - 03:10 pm
|
|
|
Dear Prof.,
Thanks for your reply.
Further information related to the topic could be found at http://forums.esri.com/Thread.asp?c=139&f=1724&t=227637
Best regards,
Tri Van |
|
|
| Back to top |
|